Online resources for teaching
Abstract: In this session I will try to show some utilities present in the web. One of them will help us to execute R code from the web, using an online compiler, without installing any kind of software in our computers. The other one, it can help us to solve optimization problems by a graphics way. We can draw the restrictions, the feasible region, and others elements that we can need to solve the problems. Finally, I will show other helpful options for teaching.
R (online)
Introduction
Why do we need to use online software?
When we try to teach in a computers room, we often have different problems such as:
-
Computers configured to restart every day.
-
Probably, some kind of software is not installed.
-
Or students using their own laptop.
In the last case there is even an additional problem, the enormous number of versions available.
A solution
In order to solve this problem, I think that it is a good idea to use online software. Why?
Because, all the people can access the same version of the code, with the same version of the programs, and in the case of R, with the same version of the packages.
Options
What options are on the web?
Basically, there are three options:
-
Using an online terminal.
-
Using an online compiler for scripts.
-
Using an online compiler on your own website.
In most cases, compilers will have the basic packages loaded, but, even so, the versions might be different.
Executing the following instruction:
installed.packages(.Library)
We will be shown the packages that are installed in the online Servers.
An online terminal
In this case the R version is 3.4.1 (2017-06-30)
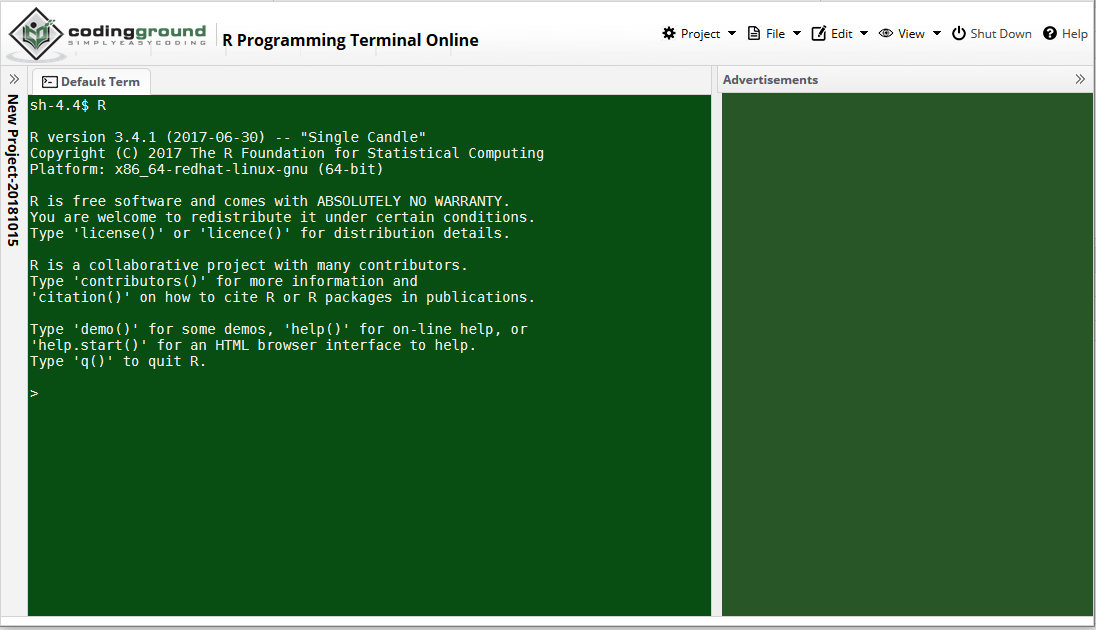
Example of an online terminal (https://www.tutorialspoint.com/unix_terminal_online.php)
An online compiler on your own website
Another option would be to add, on your own web page, an HTML box with a code that allows you to embed an R compiler. To run the code, just write it inside the mentioned box and, when executed, the result will be shown on our web page.
In this case, you only need to write this code in a html box.
<iframe width='100%' height='100%' src='https://rdrr.io/snippets/embed/' frameborder='0'></iframe>
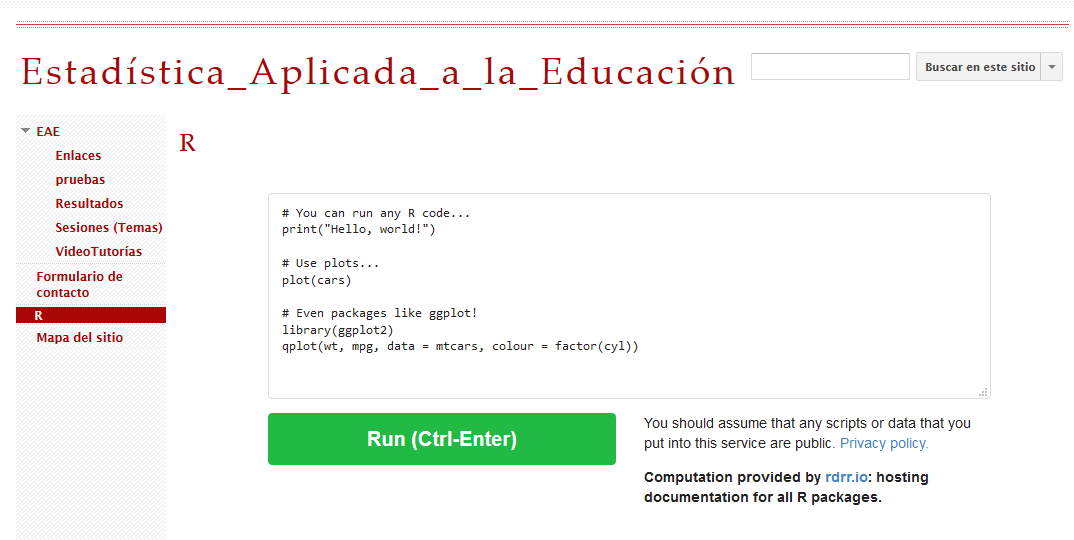
Example of an embedded compiler in your own web (https://sites.google.com/site/estadisticaaplicadaaeducacion2/r)
If we ask in R for the version, it shows:
               _
platform       x86_64-pc-linux-gnu
arch           x86_64
os             linux-gnu
system         x86_64, linux-gnu
status
major          3
minor          4.1
year           2017
month          06
day            30
svn rev        72865
language       R
version.string R version 3.4.1 (2017-06-30)
nickname       Single Candle
An online compiler for scripts
Using this option we can access a web page with an online compiler and write the commands that will be executed on the server. The results (text and graphics) will be displayed on the same web.
For this case the following 3 options are presented, they are not all that exist, but it is a good sample of online R compilers:
Rextester
– It is a generic compiler which supports several languages such as C ++, Python, R, Visual Basic, etc.
– It allows to save the code and generates a unique URL to access it.
– As for R, it is currently running version R version 3.3.2
– It has an option (LIVE COOPERATION) that allows for collaboration in real time.
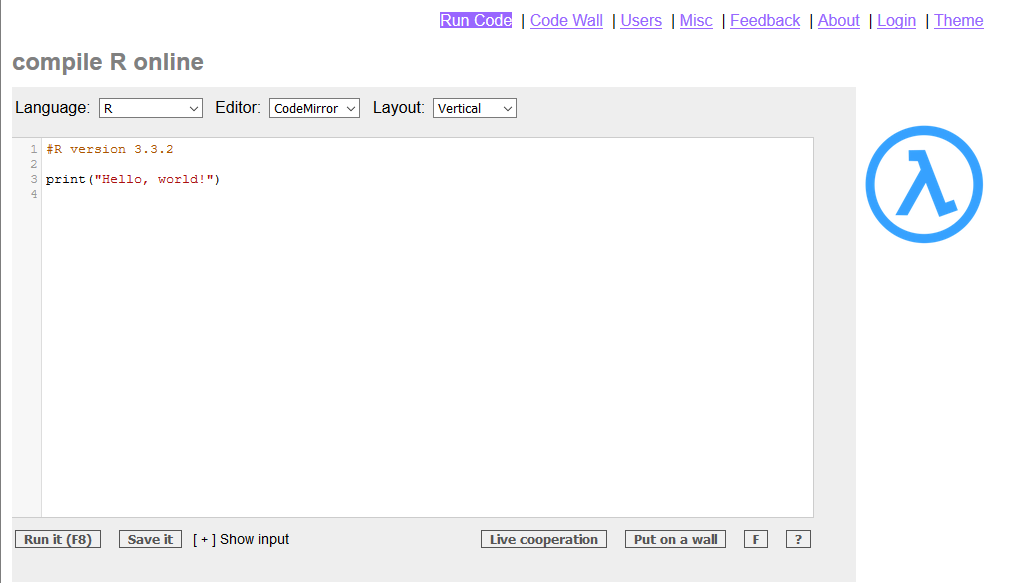
Example of the application at https://rextester.com/l/r_online_compiler
Jdoodle
– It also compiles different programming languages.
– In the case of R, you can choose between three versions: R 3.3.1, R 3.4.2 and R 3.5.0.
– If you register, you can access (among others) the following features: Save, My projects, Recent, Collaborate etc.
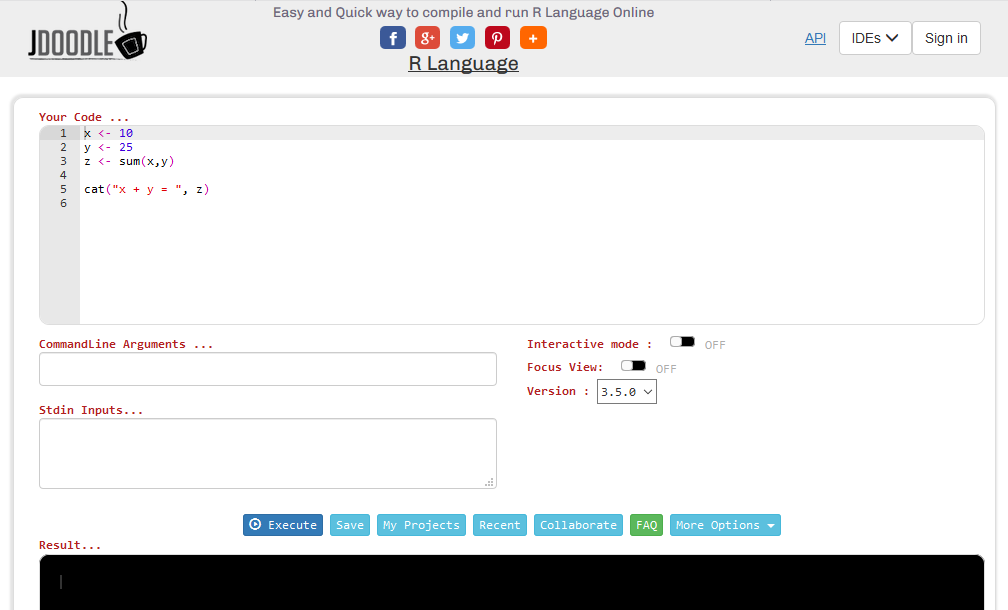
Example of the application at https://www.jdoodle.com/execute-r-online
Tutorialspoint
– It is an R compiler for version 3.4.1.
– It can be shared if you are registered.
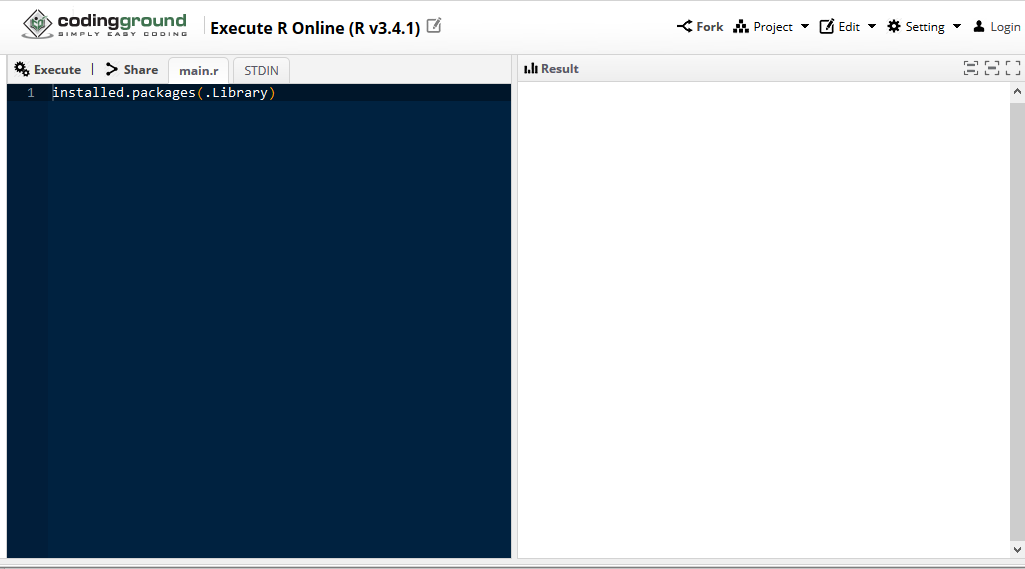
Example of the application at https://www.tutorialspoint.com/execute_r_online.php
Examples
-
Distribution of the sample mean.
http://www.r-fiddle.org/#/fiddle?id=JjNDLEk3&version=6 -
Dice (See how the probability converges to 1/6).
https://rextester.com/GFO27631 -
Coins (See how the probability converges to 1/2).
https://rextester.com/PMXS69220 -
Definition of a Chi-square distribution.
If $X_i->N(0,1)$, and $Y=\sum{X_i^2}$, then $Y$ follows Chi-square distribution.
http://www.r-fiddle.org/#/fiddle?id=x2IrLlmq&version=1 -
Definition of a t-Student distribution.
If $X_i -> N(0,1)$, and $Y=\sum{X_i^2}$, then $T=\frac{X_i}{\sqrt{\frac{Y}{n}}}$ follows a t-Student distribution.
http://www.r-fiddle.org/#/fiddle?id=ph6cnsbI&version=1 -
Help for tasks.
https://rextester.com/OYWAF88158
GeoGebra (online)
Probability distributions
You can use GeoGebra in order to consult values and probabilities from distributions.
 Probability distributions (https://www.geogebra.org/classic#probability)
Apps
GeoGebra allows you to create apps without signing up.
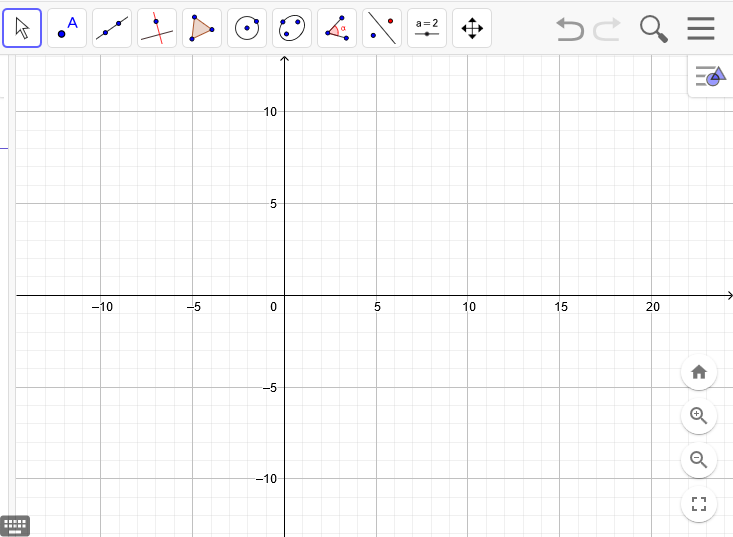 Geogebra online (https://www.geogebra.org/)
Nevertheless, you can obtain all the best if you log in. In that case you can save the apps in the server (online), and share them with your students.
In the image below it is shown the different forms of signing in for GeoGebra.
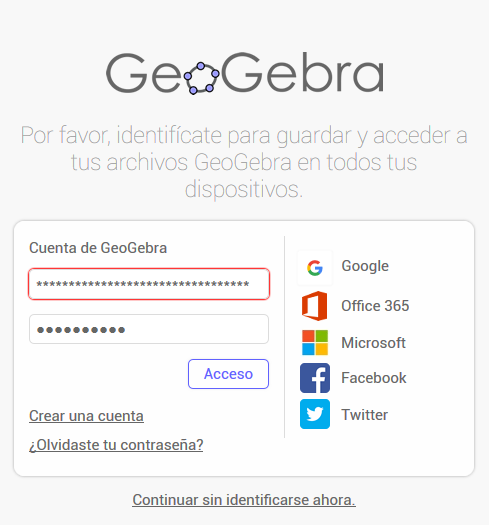
Examples
As mentioned before, you can create a group to exchange apps with your students, for example this: GeoGebra Group -> OySelE (QY7KT)
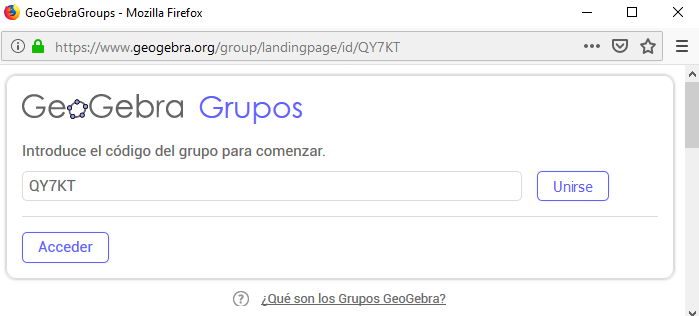 Example of GeoGebra Group (https://www.geogebra.org/group/landingpage/id/QY7KT)
As an example, Problem 3.1
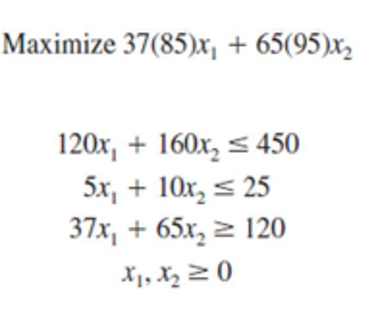 https://www.geogebra.org/m/qvKCCPMX/pe/166447
PSPP (online)
GNU PSPP is a program for statistical analysis of sampled data. It is free as in freedom replacement for the proprietary program SPSS, and it looks very similar to it within a few exceptions.
To use it, you must need to log in first.
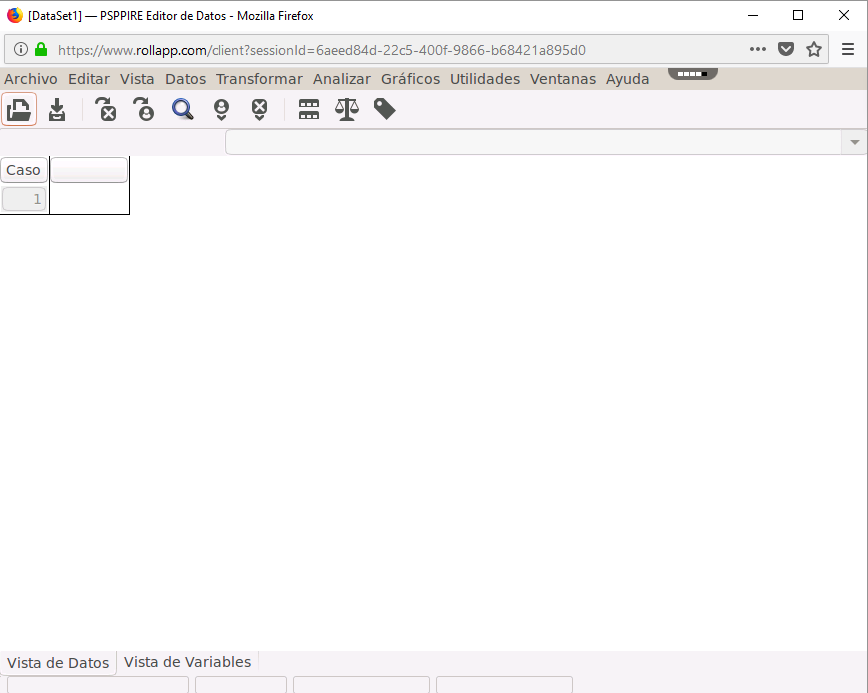 PSPP on rollApp (https://www.rollapp.com/app/pspp)
RawGraphs
What is RAWGraphs?
In its own site says: RAW Graphs is an open source data visualization framework built with the goal of making the visual representation of complex data easy for everyone.

RawGraphs (https://rawgraphs.io)
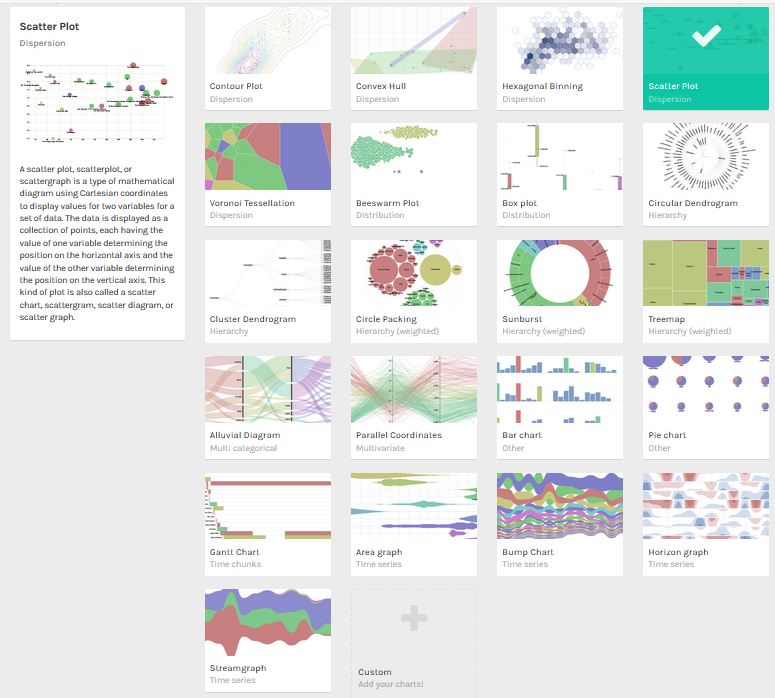
In the next picture you can see some examples of graphics that you can make with Raw. When you select one, a short description will apppear on the left side panel.
# Data for an example in Raw.
# copy and paste in Raw.

Exam1, Exam2, Exam3
A, A, A
A, NA, NA
A, A, NA
A, NA, A
NA, A, A
NA, NA, A
NA, NA, NA
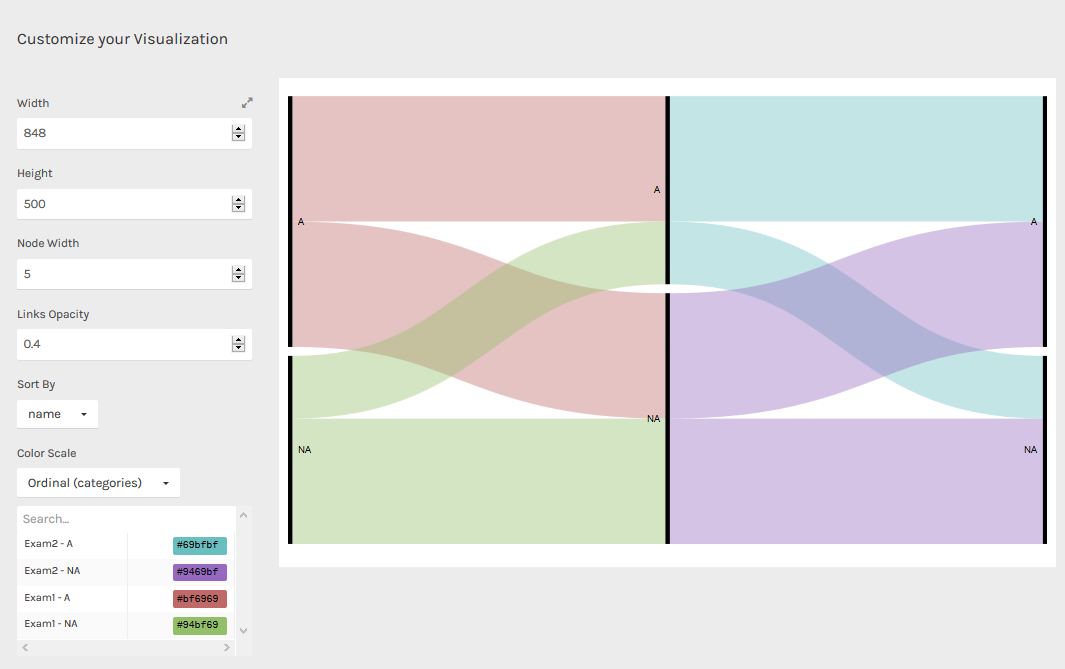
If we choose an alluvial diagram, this is the result.
